The City of Courtenay, Province of B.C. and individual homeowners are taking action to reduce smoke impacts. Below are some of the measures that reduce the impacts of wood smoke in the community.
Wood smoke affects everyone, but especially children, seniors, pregnant women and people with existing lung and heart conditions. The B.C. Lung Foundation has identified many hazardous substances in wood smoke including: fine particulate matter (PM2.5), carbon monoxide (CO), nitrogen oxides (NOx), volatile organic compounds (VOCs), and polycyclic aromatic hydrocarbons (PAHs). Exposure to wood smoke increases the likelihood that health conditions will develop.
Exposure to smoke can worsen conditions like asthma or COPD, reduce lung function and increase the risk of a heart attack or stroke. It can also cause lower birthweights, ear and respiratory infections in children and shortened lifespans.
What is fine particulate matter (PM2.5)?
- PM2.5 is the scientific name for miniscule particles with a diameter of less than 2.5 micrometers (a micrometer is a millimeter, divided into a thousand!) PM2.5 is a key component of smoke.
- Measuring about 20x smaller than a human hair, fine particulate matter is small enough to inhale, travel through our bloodstream, and seep through cracks in buildings even when the doors and windows are closed.
- Research suggests that there is no safe level of PM2.5. Exposure to PM2.5 can negatively impact the heart and lungs and can lead to health issues such as asthma symptoms, chronic bronchitis, and heart attacks. Exposure to PM2.5 is also linked to more frequent emergency room visits and hospitalization for respiratory and cardiovascular problems, as well as an increased risk of premature death.
Reducing smoke impacts
Wood smoke impacts
The provincial air monitoring station at Courtenay Elementary School has been collecting data since 2011, and tracking how conditions have changed at this location over time.
To better understand how air quality varies across the region, the City, together with local organizations and residents, have added PurpleAir monitors. These sensors show real-time measurements of fine particulate matter, and report them on the online map.
Measurements are compared against B.C. Air Quality Objectives, which specify the maximum allowable concentration of pollutants.
What we've learned from air monitoring
- Annual trends: The average annual concentration of fine particulate matter, a key ingredient in smoke, has been dropping since 2017. This indicates the air is less smoky on average. While this improvement can’t be linked to a single factor, it likely comes from stricter rules on slash burning and fewer wood-burning appliances.
- Daily spikes: Daily spikes of fine particulate matter occur during winter evenings and early mornings from October to March. During these times, air quality does not meet the B.C. air quality objectives. This pattern matches when people are likely to be home and using wood-burning appliances.
- Neighbourhood differences: On winter nights, there can be wide variation between the monitor readings. Older neighbourhoods with wood-burning appliances show the highest readings of fine particulate matter. Because these sources are close to homes, they affect health more than smoke from distant wildfires.
- Geography: Courtenay's location between the mountains and ocean creates conditions that trap pollutants close to the ground.
For more information about monitors and readings, visit the Air quality monitoring page.
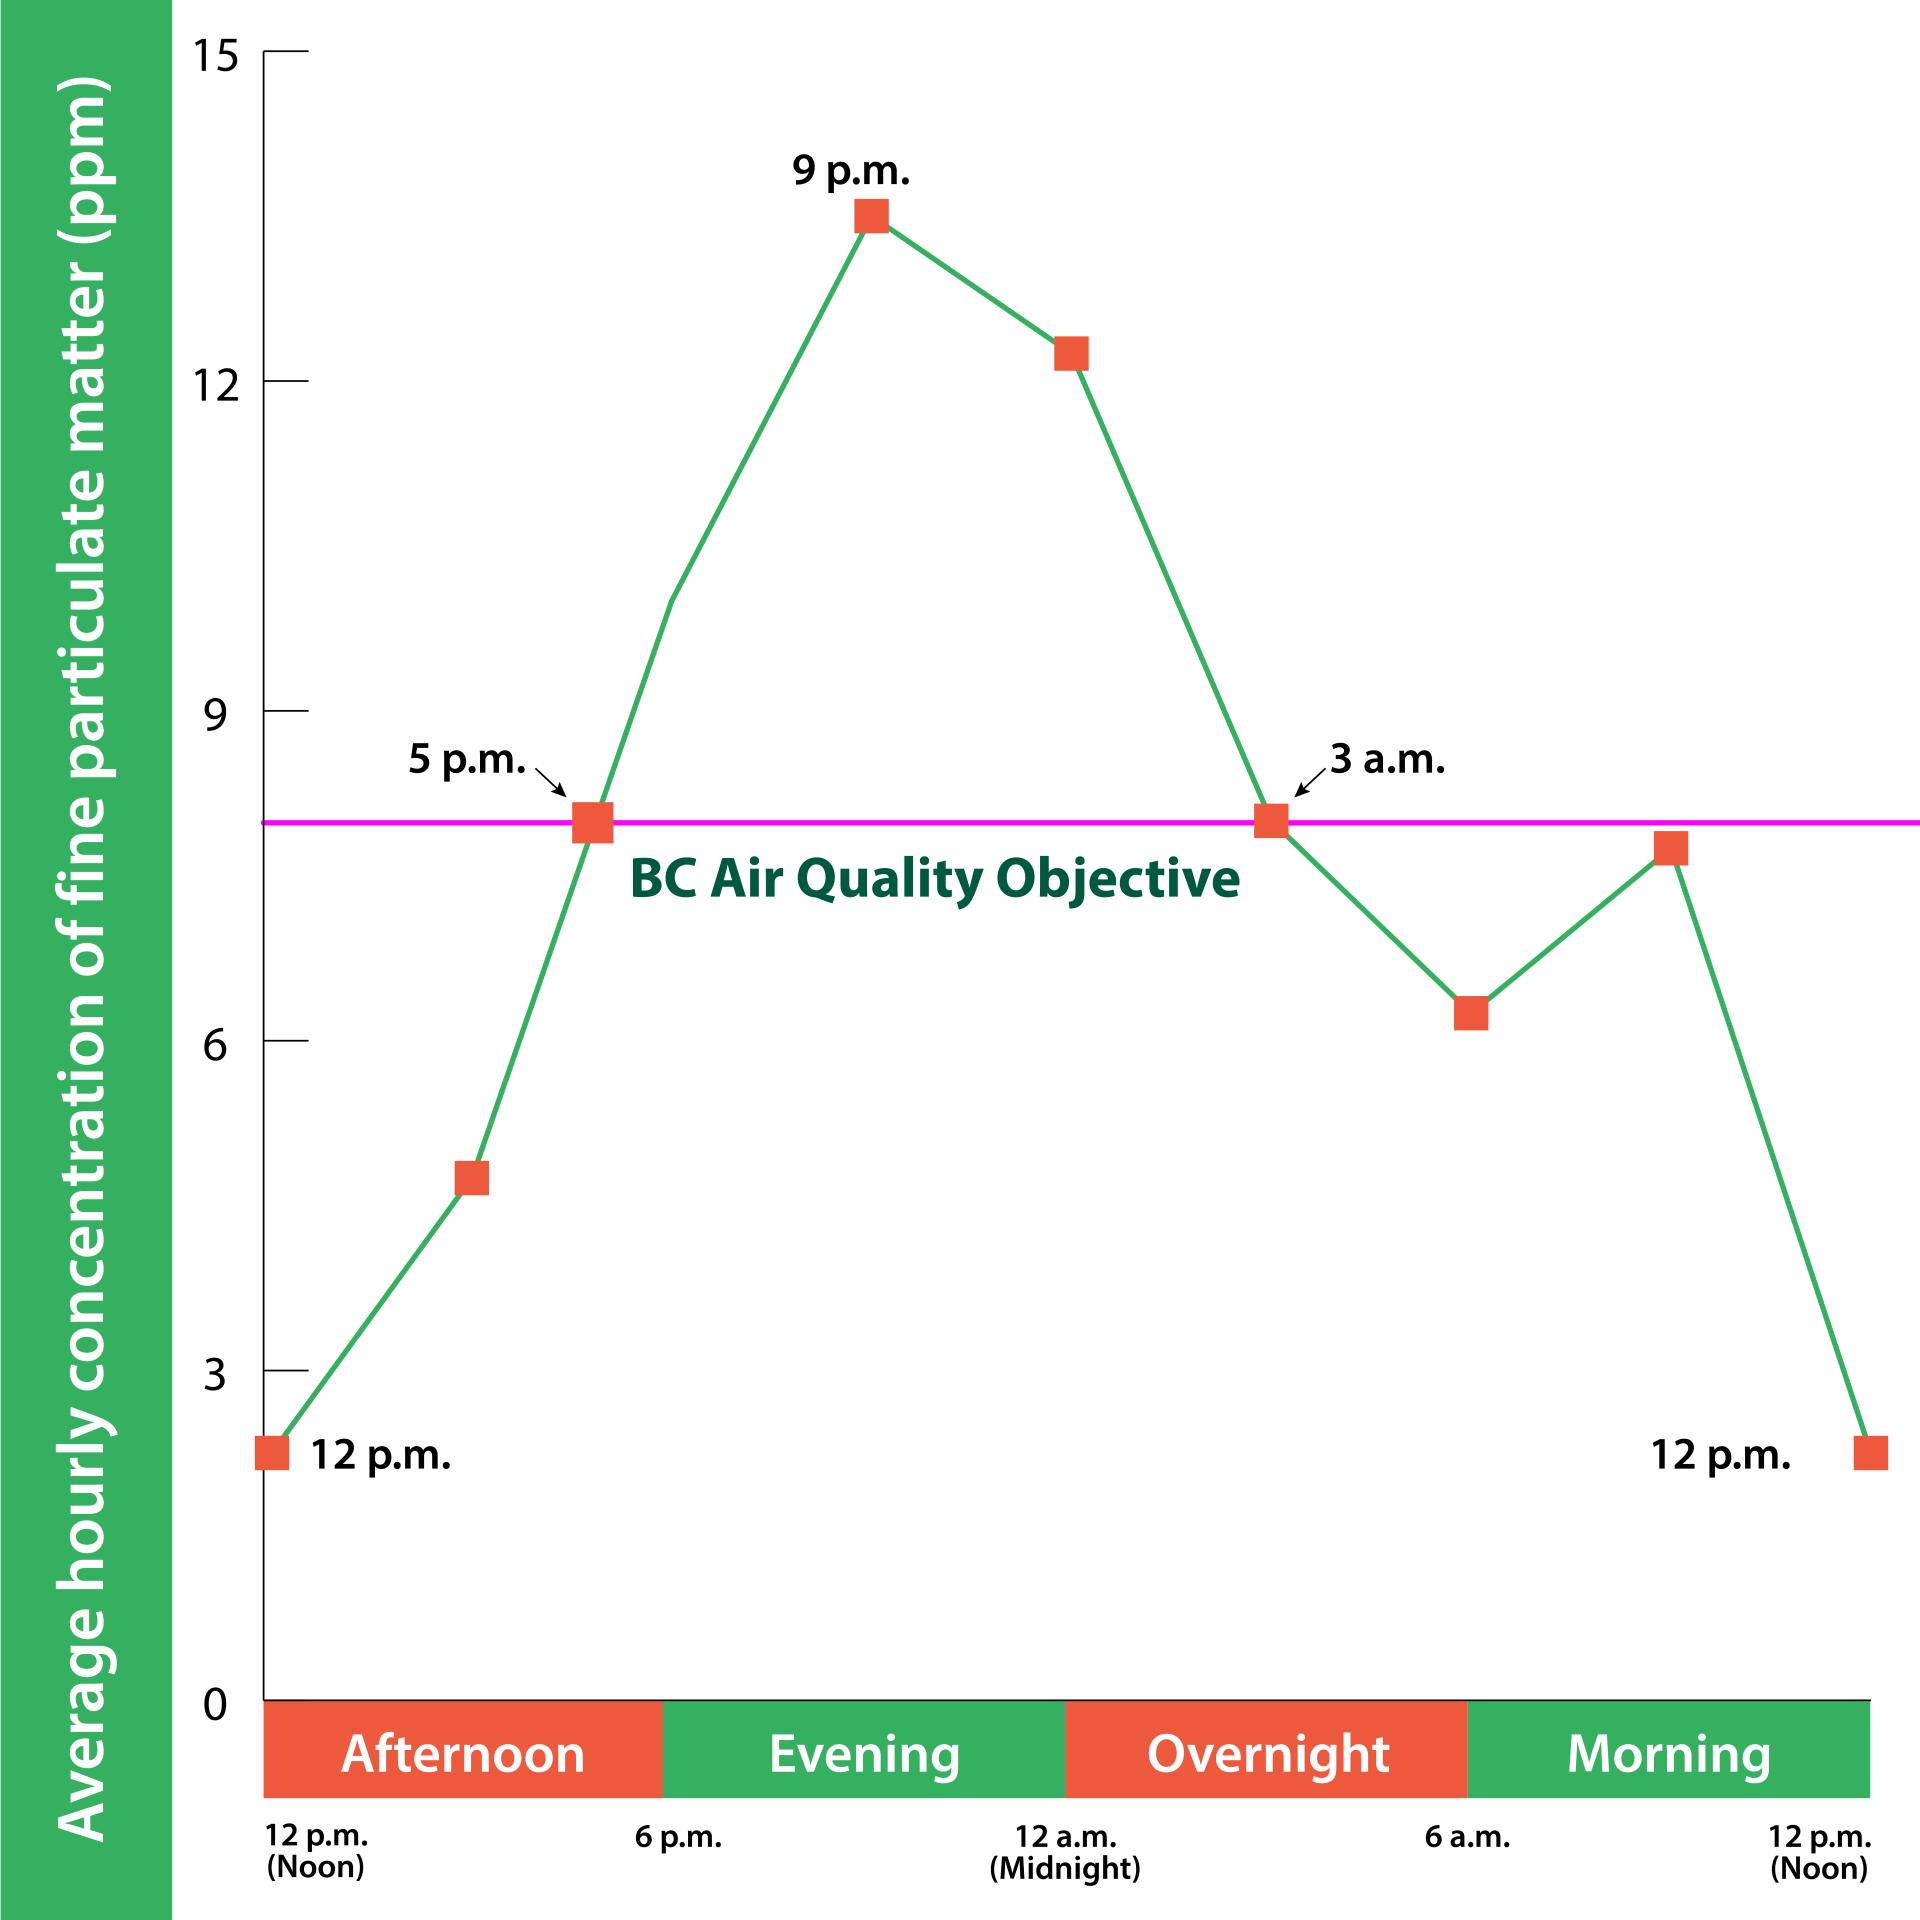
Average hourly measurements
Looking at the average hourly concentrations of PM2.5 during a typical winter day, we can see that after 5 p.m., fine particulate matter exceeds B.C. air quality objectives, peaking at 9 p.m., remaining high until early morning.
Image
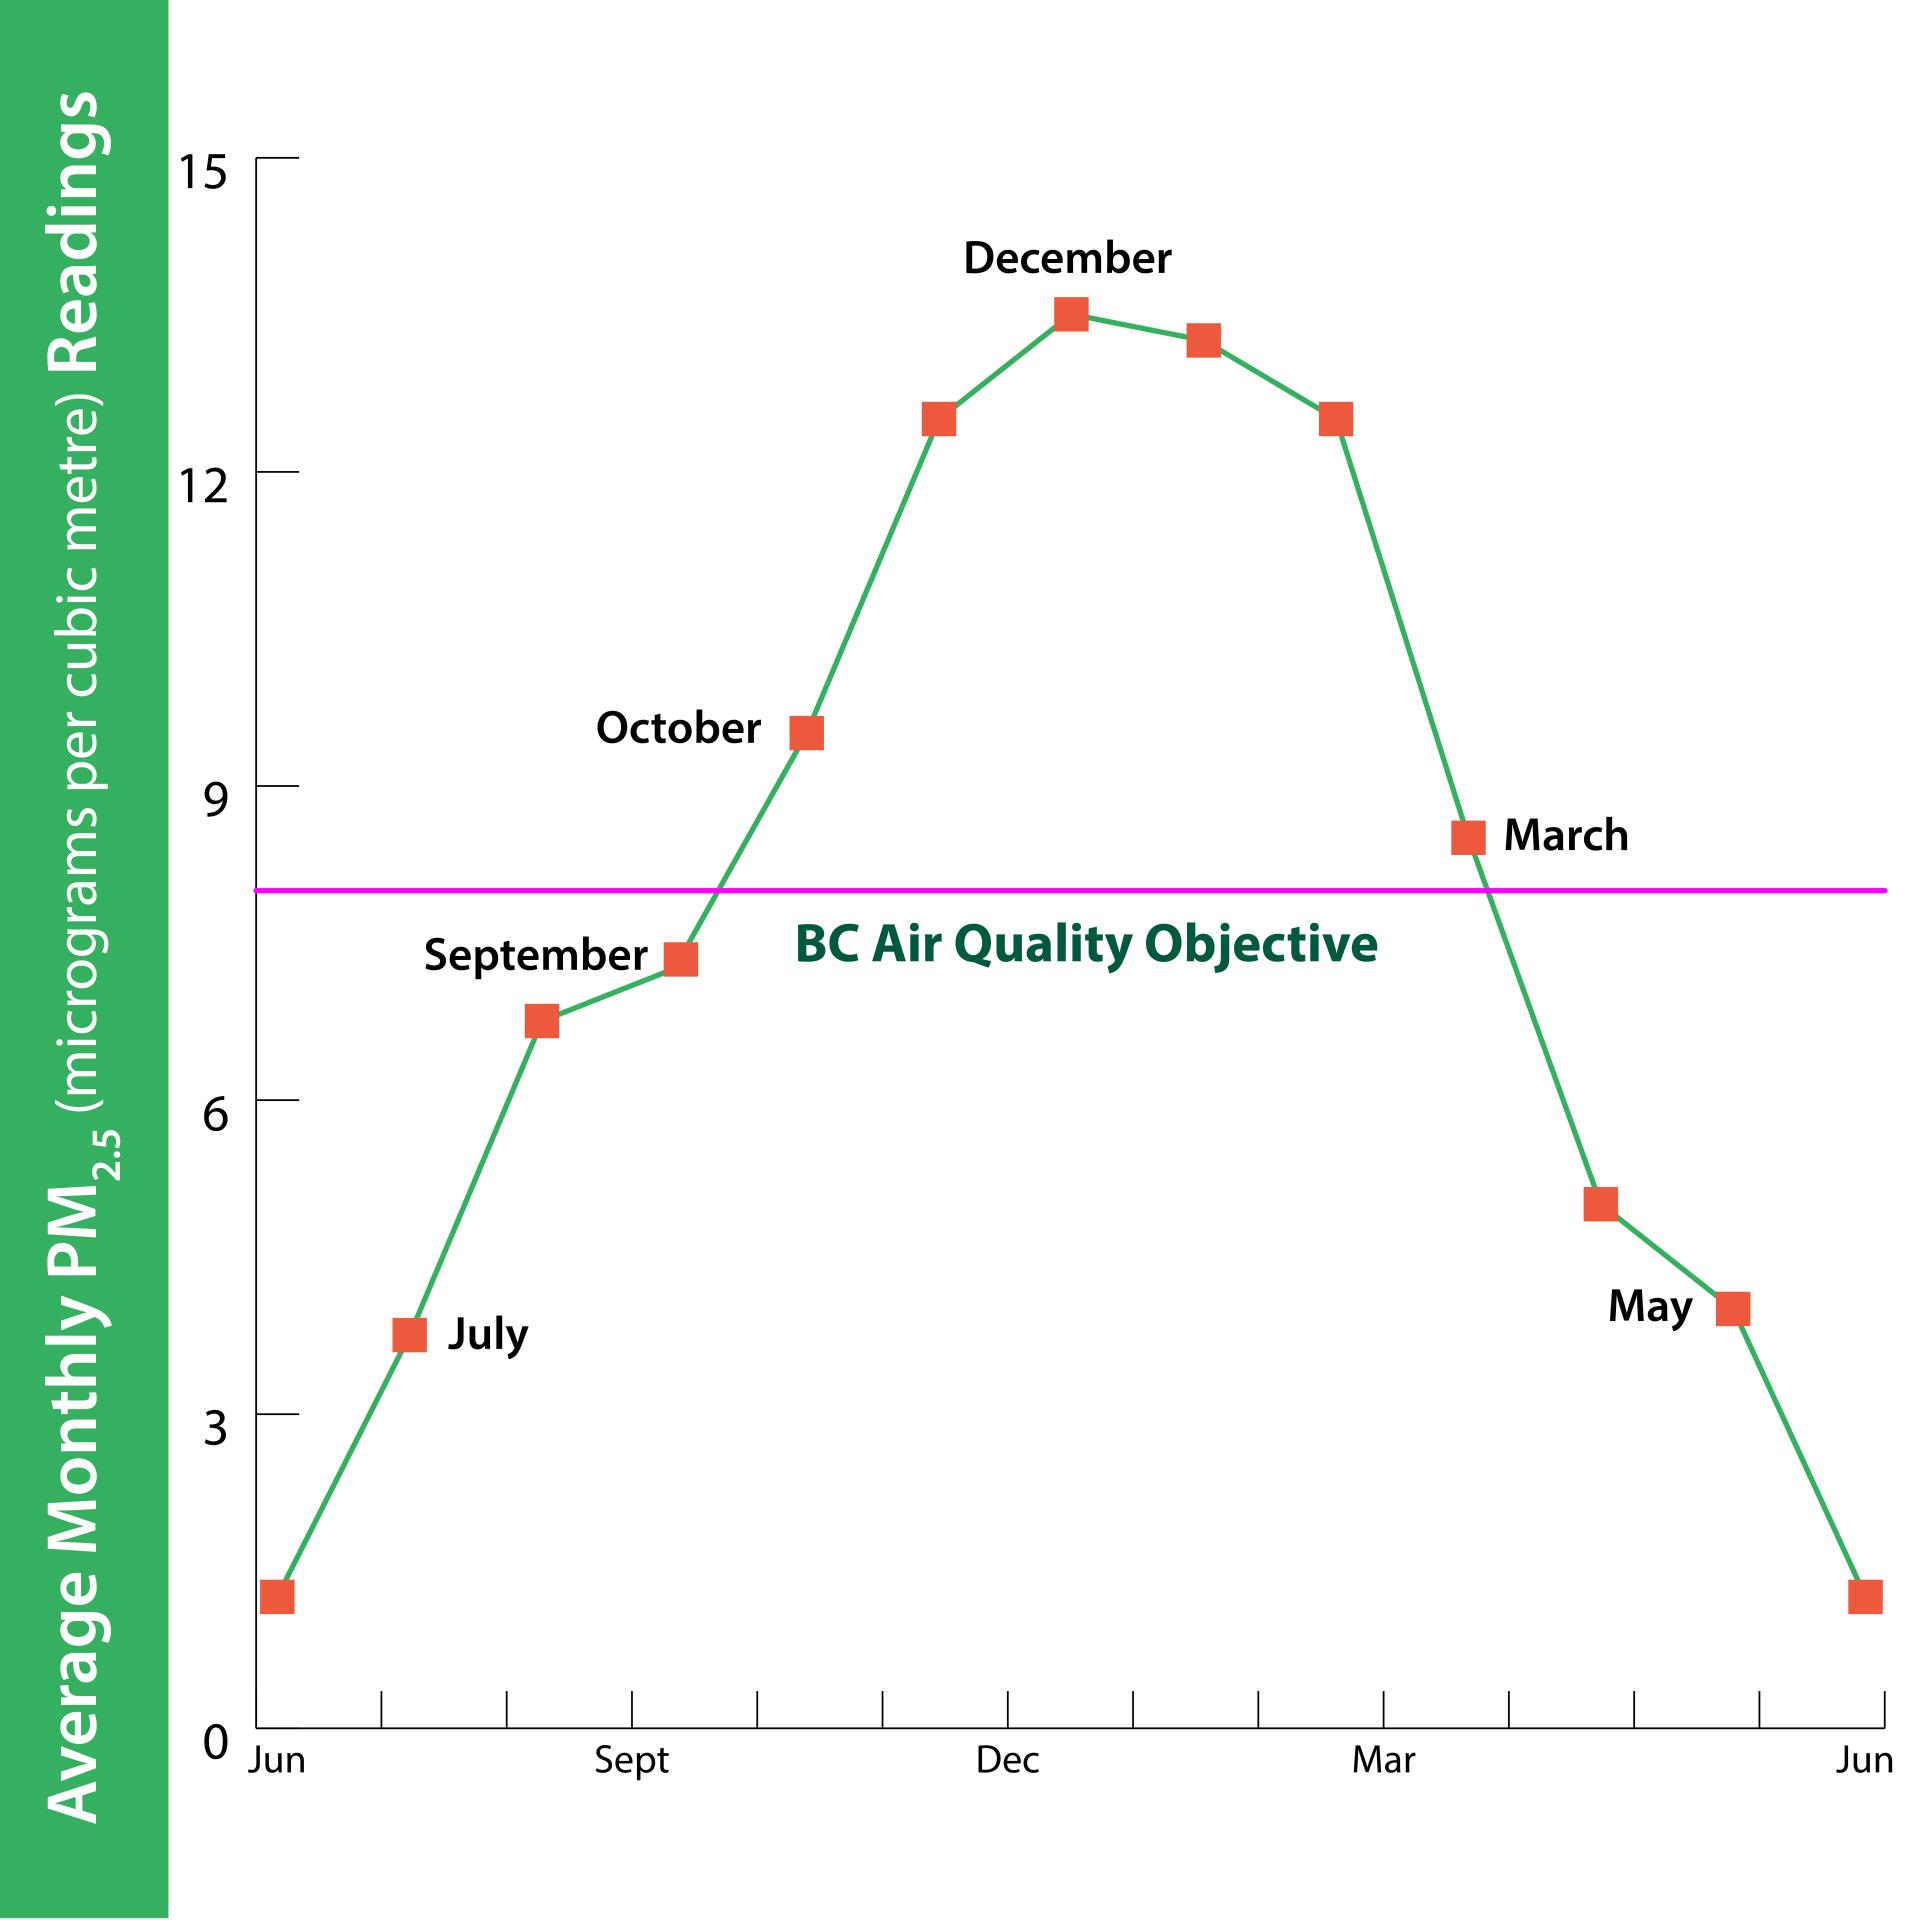
Average monthly measurements
The graph below shows the average monthly concentrations of PM2.5. During the winter, from mid-September to mid-March, concentrations of PM2.5 exceed the B.C. air quality objectives. This timing aligns with the seasonal use of wood-burning appliances.
Image