The provincial air monitoring station at Courtenay Elementary School has been collecting data since 2011, and tracking how conditions have changed at this location over time.
To better understand how air quality varies across the region, the City, together with local organizations and residents, have added PurpleAir monitors. These sensors record real-time measurements of fine particulate matter (also known as PM2.5).
Measurements are compared against B.C. Air Quality Objectives, which specify the maximum allowable concentration of pollutants.
Air Monitoring Network
The City of Courtenay has installed PurpleAir monitors on public buildings across the city, adding to a growing network of private and public air monitoring locations across the Comox Valley. These monitors measure fine particulate matter (PM2.5), which threatens air quality in the Comox Valley.
By increasing the number of air monitoring locations, we can learn more about how PM2.5 concentrations vary in our neighbourhoods over time. PurpleAir monitors are low-cost air quality sensors that use laser particle detectors to measure PM2.5 concentrations in the air. Real-time readings from these sensors are available online at PurpleAir.
The BC Ministry of Environment and Climate Change Strategy endorses the use of PurpleAir monitors and has created data management tools to include measurements from these devices in the provincial air monitoring dataset.
Understanding the readings
Readings from PurpleAir monitors indicate the amount of PM2.5 in the air at a specific location, at a moment in time. The higher the number, the more PM2.5 in the air. The monitors are responsive to local sources of PM2.5, so the measurements may change quickly.
- PurpleAir monitors are sensitive to humidity, so a correction factor must be applied to allow for an accurate comparison to the BC Air Quality Objectives.
- Corrected measurements are reported on a map hosted by the University of Northern British Columbia (UNBC) Atmospheric Sciences program: UNBC Hourly PM2.5 Observations map
- The BC Air Quality objectives for fine particulate matter are:
- 25 ug/m3 (micrograms per cubic meter), averaged over a 24-hour period; and
- 8 ug/m3 (micrograms per cubic meter), averaged over a year.
For more information about fine particulate matter and impacts of wood smoke, visit the Wood smoke impacts page.
How can I monitor air quality in my neighbourhood?
Consider expanding our local network by installing your own PurpleAir monitor. The sensors can be purchased directly from PurpleAir. They require a USB power source and access to wireless internet.
What we've learned from air monitoring
- Annual trends: The average annual concentration of fine particulate matter, a key ingredient in smoke, has been dropping since 2017. This indicates the air is less smoky on average. While this improvement can’t be linked to a single factor, it likely comes from stricter rules on slash burning and fewer wood-burning appliances.
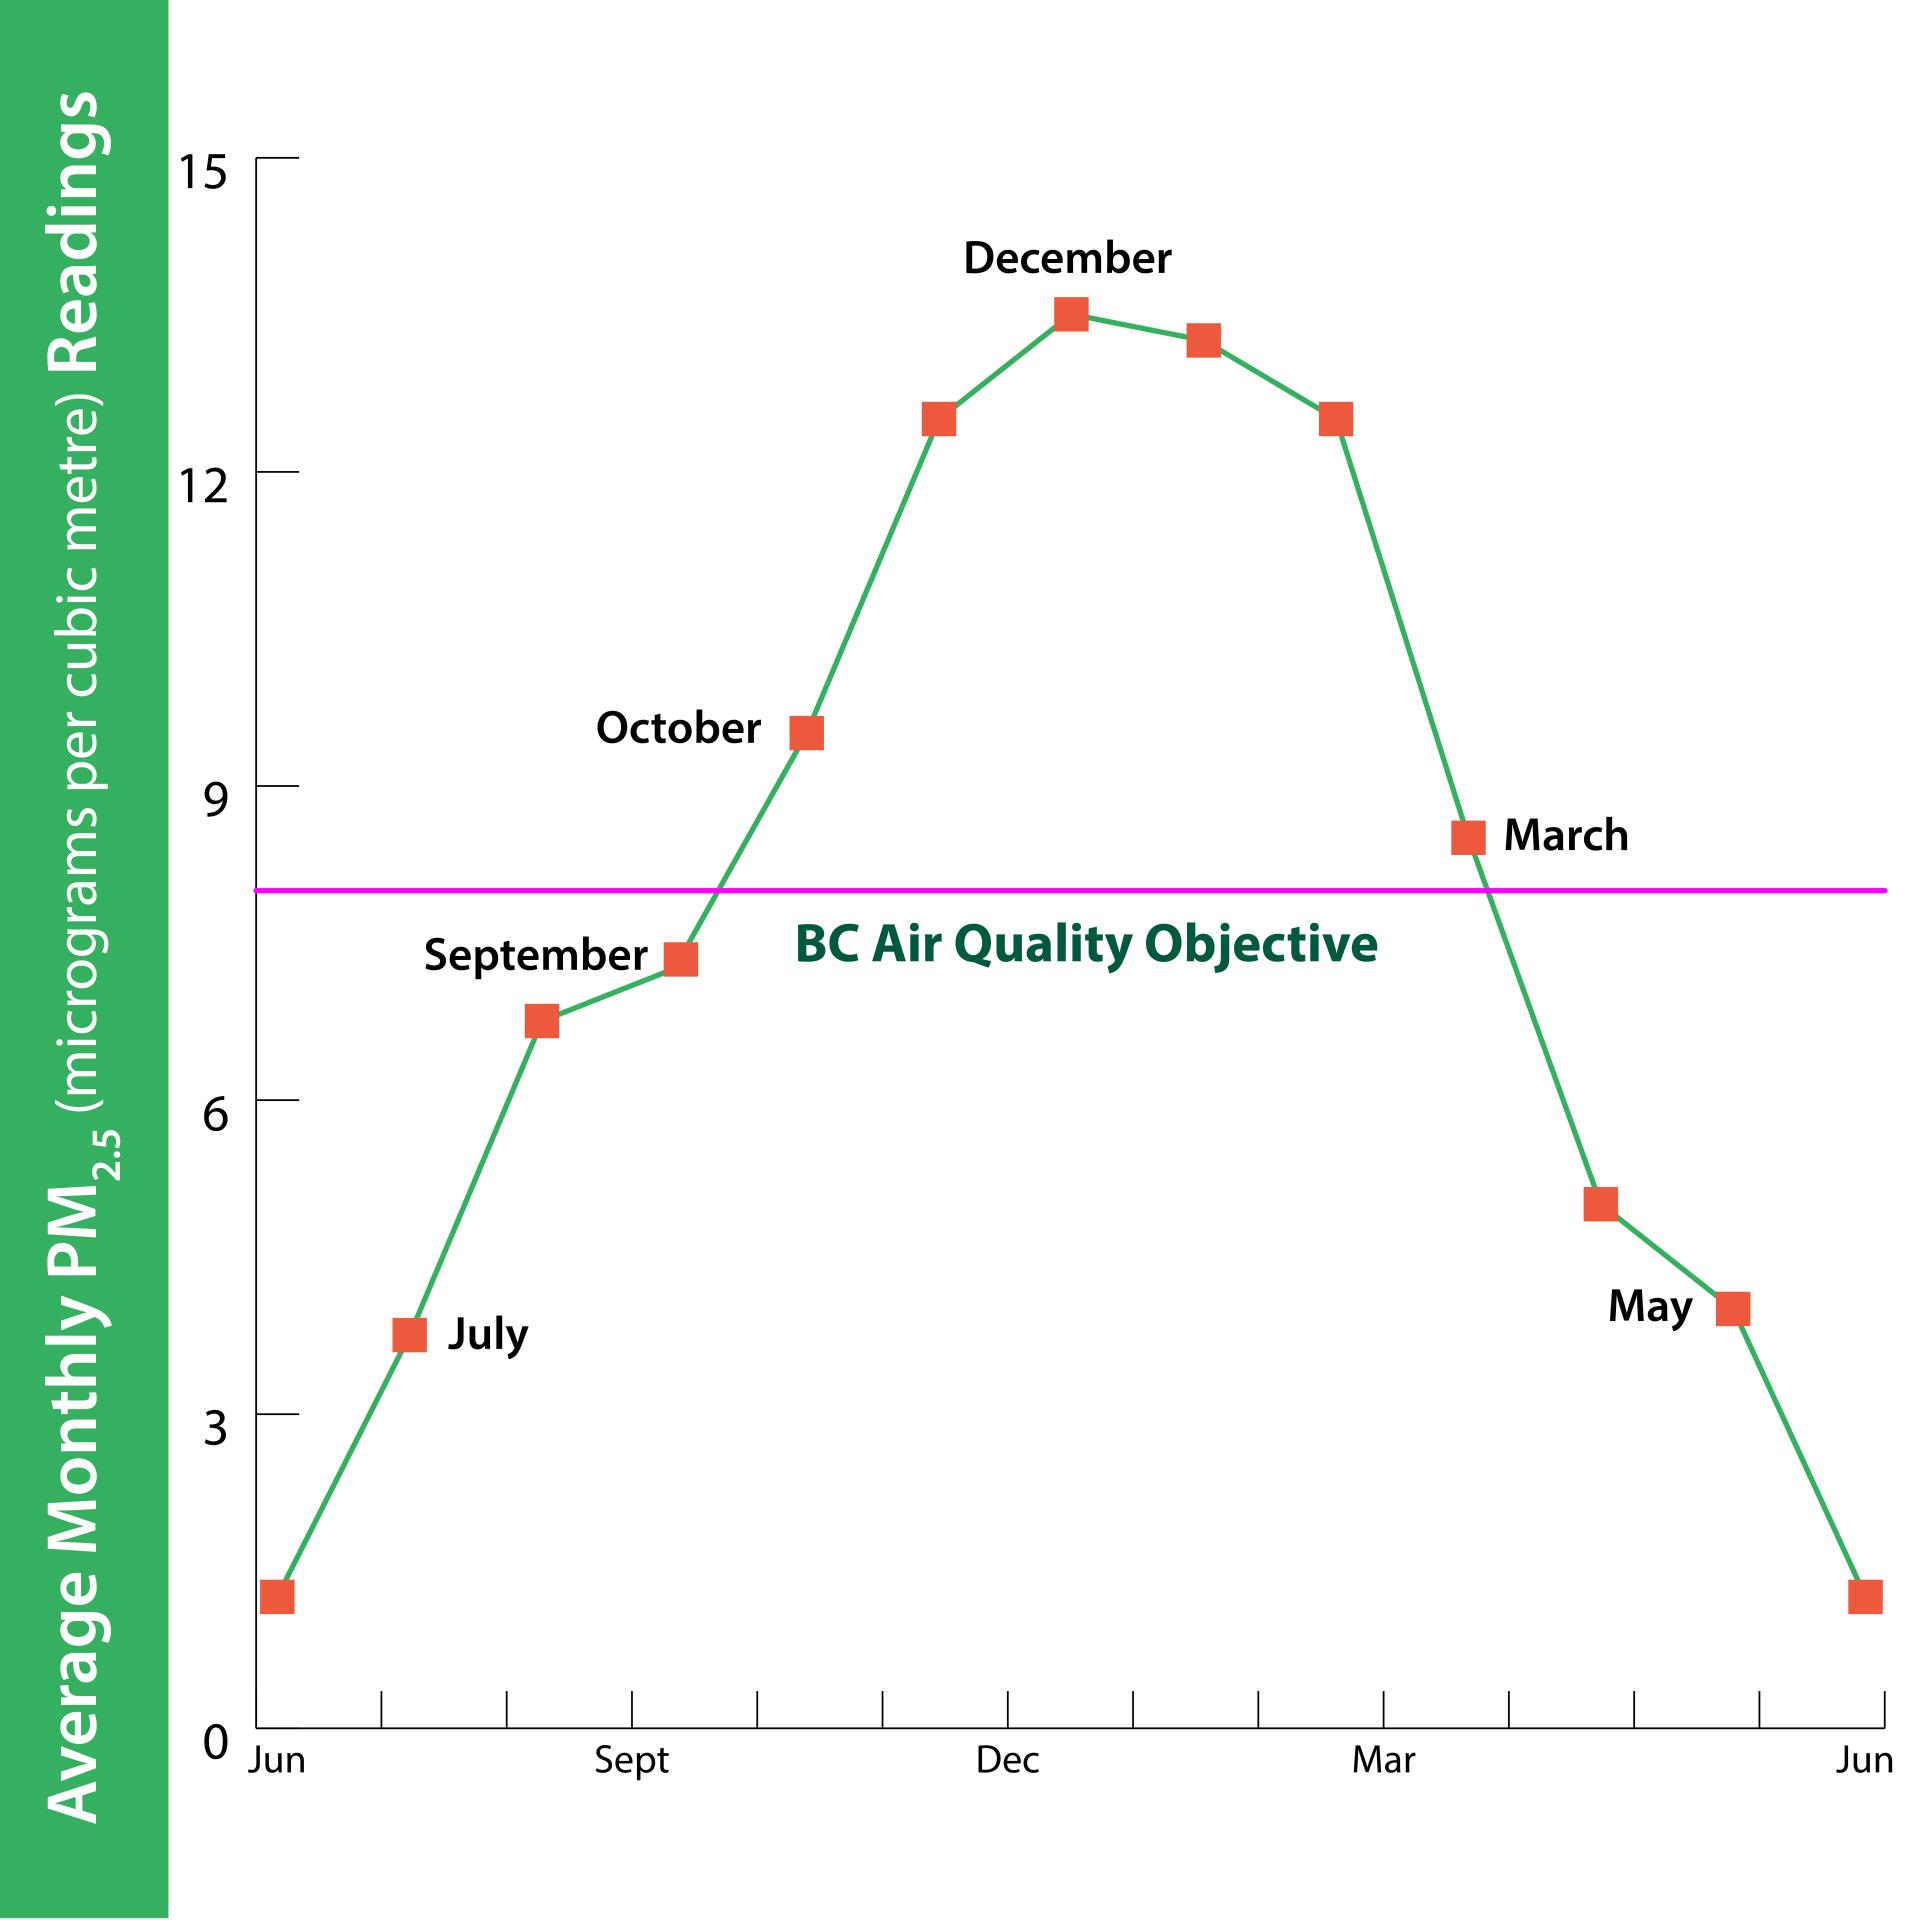
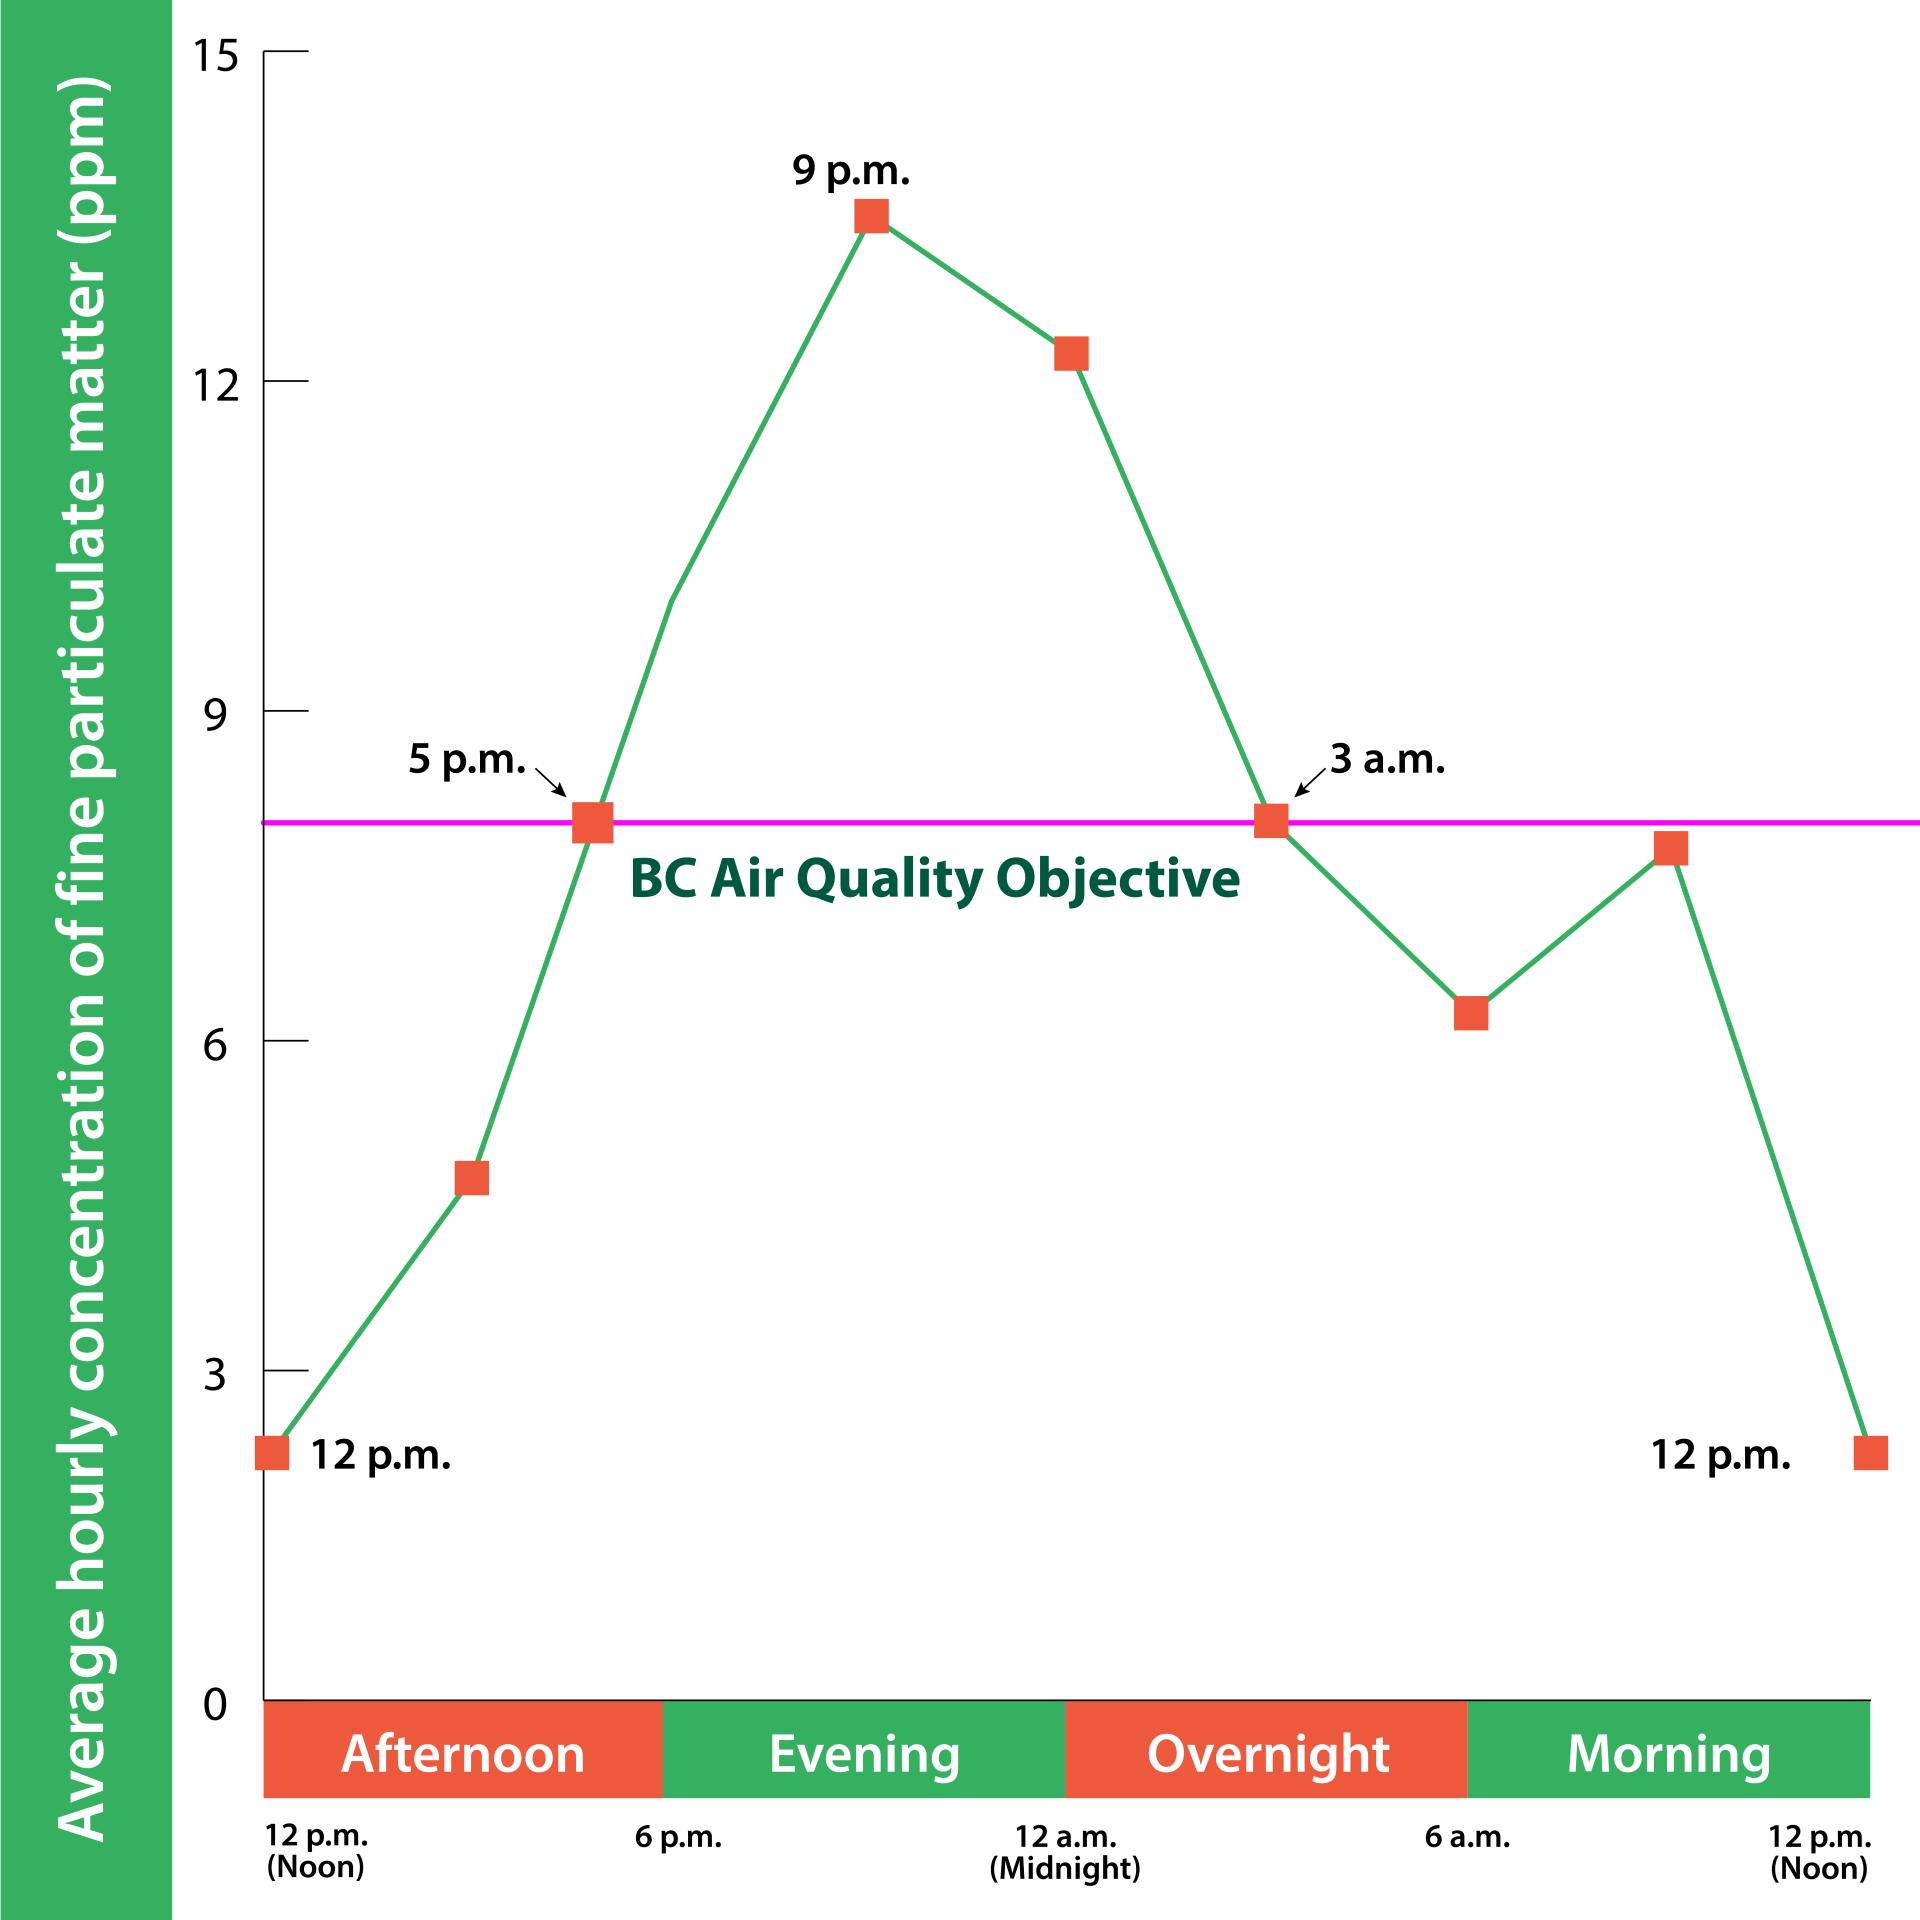
- Daily spikes: Daily spikes of fine particulate matter occur during winter evenings and early mornings from October to March. During these times, air quality does not meet the B.C. air quality objectives. This pattern matches when people are likely to be home and using wood-burning appliances.
- Neighbourhood differences: On winter nights, there can be wide variation between the monitor readings. Older neighbourhoods with wood-burning appliances show the highest readings of fine particulate matter. Because these sources are close to homes, they affect health more than smoke from distant wildfires.
- Geography: Courtenay's location between the mountains and ocean creates conditions that trap pollutants close to the ground.
Average hourly measurements
Looking at the average hourly concentrations of PM2.5 during a typical winter day, we can see that after 5 p.m., fine particulate matter exceeds B.C. air quality objectives, peaking at 9 p.m., remaining high until early morning.
Average monthly measurements
The graph below shows the average monthly concentrations of PM2.5. During the winter, from mid-September to mid-March, concentrations of PM2.5 exceed the B.C. air quality objectives. This timing aligns with the seasonal use of wood-burning appliances.